The PREPA deal has been rejected by the oversight board. Presumably leading to a much bigger PREPA bond haircut than the 25% or so proposal. The bonds have dropped from the low to mid 60s to the mid 50s on the back of this.
Even then, seems like a really punitive haircut is a real possibility and not discounted by the market with a mid-50s bond price.
https://emma.msrb.org/SecurityDetails/TradeActivity/A4E4A05FC0DDC577A68DDF57DF6A9B5C2
https://seekingalpha.com/article/4084081-puerto-ricos-oversight-board-must-kill-prepa-bond-deal
http://www.gdb-pur.com/documents/PlanFiscal13demarzo2017.pdf
Wednesday 28 June 2017
Tuesday 27 June 2017
PDVSA bonds holding steady...
PDVSA bonds haven't sold off much despite the increasing anti-Maduro violence, economic problems and the view on the oil price souring. PDVSA's production profile has been falling steadily over the last few years presumably due to lack of capex. If the market thought the curve should be flat in the 30s 15 months ago, pricing in a certainty of default, hard to see why it should be in the 50s now and only partially pricing in default risks. Shown are the Nov 2021 USD bonds.


The passing of baby boomer economics and politics
Baby boomer politicians/ policies have been rejected in elections over the last year, whether Trump, Sanders, Brexit or other near misses in the EU.
In the UK we have the following. US is a slightly different mix of issues and the EU countries are a bit more social democrat. But basically the same themes run across all of these countries, just a slightly different mix.
What the Baby Boomers got wrong:
Basically they are the artist/ prophet generations coming in the first and second turnings and now going into retirement as we proceed through to the end of the third turning.
They are being displaced in part as Millennials and Gen-X'ers are voting more and in part as baby boomers start to die off.
The latter two need change and are voting it in and the change will pretty much deliver the opposite of the above. Any politician who doesnt get that and who doesnt deliver a change based policy platform has little chance.
In the UK we have the following. US is a slightly different mix of issues and the EU countries are a bit more social democrat. But basically the same themes run across all of these countries, just a slightly different mix.
What the Baby Boomers got wrong:
- Didnt pay for their education but charged their children's generation
- Havent saved for retirement
- Havent funded their pensions
- Havent funded their social care/ health care liabilities
- Havent built enough housing/ have blown up price bubbles
- Have protected the green belt
- Put causes ahead of pragmatism, eg foreign aid budget, green energy, multi-culturalism
- Have allowed the manufacturing sector to be gutted
- Ran up a massive debt pile as they didnt fund their spending at the government level
- Are responsible for the boom/ bust economics
- Repeatedly elected a class of career politicians who did nothing but use focus groups and corporate lobbyists and avoided hard decisions - avoiding hard decisions is a key baby boomer trait
- Allowed mass immigration particularly with lowly educated people from cultures that do not integrate into a modern, western, law abiding lifestyle
- For fear of hurting feelings, constrained the police and allowed large urban areas to become no-go areas
- Allowed organisations such as ISIS and Al-Qaida to become established
Basically they are the artist/ prophet generations coming in the first and second turnings and now going into retirement as we proceed through to the end of the third turning.
They are being displaced in part as Millennials and Gen-X'ers are voting more and in part as baby boomers start to die off.
The latter two need change and are voting it in and the change will pretty much deliver the opposite of the above. Any politician who doesnt get that and who doesnt deliver a change based policy platform has little chance.
Thursday 22 June 2017
Berkeley Group exposes the London housing/ land price bubble
So on the back of this Grenfell Tower fire there is a problem rehousing families in the immediate area. The area is split between council estates, some of the most expensive property in west London plus various infill developments of brown field land.
While I fully support rehousing locally and more generally I supported Labour's 1m affordable homes policy, something interesting has taken place.
Berkeley sold 68 apartments in a luxury block 'for build cost' or £10m, or £150k per flat, versus a supposed selling price in the market of £160m, or £2.35m per flat plus service charges.
Berkeley to me are doing a few things:
- Revealing the ridiculous state of the prime housing bubble
- Offloading inventory they probably cant sell
- Killing the marketability of the remaining 60% of this development
- Screwing the economics for Prudential, who are the financial backer of this '£2bn' project
- Revealing Prudential to be a residential land speculator with a 6% construction value add to realise their land investment
- I think they are probably offsetting a large social housing tax bill as well as a quid pro quo
http://www.dailymail.co.uk/news/article-4627844/Grenfell-Tower-families-moving-2bn-block.html
https://www.berkeleygroup.co.uk/new-homes/london/kensington/375-kensington-high-street
Apartment 7.10.2, a snip at £2.45m
https://www.berkeleygroup.co.uk/plot?developmentID=115&propertyID=5590035e-c197-47fb-b971-21a5978972b1

It comes complete with a 'tonal' interior and future views of an adjacent flat.

Prices are already falling but when people see transparently that they are being asked to pay £2.5m for £150k of building costs it highlights the ridiculousness of it. Where does the difference go? 25% or so profit margin to the developer, a community infrastructure levy and social housing commitment, and most importantly land costs.
Looking at Berkeley Group they have the following key numbers for 2017 (2016):
Inventories £3.48bn (£3.26bn)
Payables £1.88bn (£1.77bn) (includes £974m of pre-sales)
Net assets £2.14bn (£1.8bn)
The market cap is £4.5bn. Google finance show little long term debt (despite the above leveraged balance sheet).
Their revenue was £2.72bn vs cost of sales of £1.78bn. So costs are 65% of revenue. The company discloses only £22m in plant, property and equipment.
Completed but unsold stock totalled £87.6m in April 17 from £18.1m the year before.

They are running a huge inventory position, although £2.74bn of that had been forward sold, to some lucky buyers, who in turn had posted £974m of deposits. However they had started the year with £3.25bn of forward sales, so that number dropped £500m.
So if they sold the Grenfel Tower flats at cost of build, ~£150k each, and the commercial selling price of these flats was supposedly £160m, build costs therefore are only 6.25% of the supposed £2.35m per flat selling price.
So where is the rest going? Basically the land is a gigantic speculative bubble. Prudential are speculating on this as the financial backer of this and five other developments with Berkeley across central London.
Also the trends are somewhat ominous, Berkeley is seeing a rise in unsold stock and falling pre-sales as a percentage of projects being built. This is happening at a time that the market is just starting to come off a bubble high. What will happen if they have to force sell into a 40% down market, like in Singapore?
Separately Jeremy Corbyn is thinking of ways to tax the bejesus out of the £2m or so of land value per flat.
Tuesday 20 June 2017
FX devaluations in UK (and US) over the next few years as a rebalancing tool
We started Brexit negotiation with a decision to go for hard Brexit and questioning the legal basis of any financial settlement demanded by the EU.
EURGBP has never really held above 90p more or less since ERM was set up. So for it to happen now, on a sustained basis, is a clear sign of a weak Sterling based rebalancing framework, which cannot be positive for the EU's own imbalances.
After we get through any near term economic weakness, question is whether the market starts to look for a bit of a wage/ inflation cycle with aggressively negative real rates developing in the US and UK over the next year or two.

Looking back longer term you see the impact on Sterling of the 1970s inflation, using EUR hypothetical and XEU hypothetical exchange rates:

Friday 16 June 2017
Hong Kong resi - the real estate market which is closest to the source
Chinese credit creation/ capital flight has leaked out into prime real estate in many countries. Although in the west its being hit with taxes and Chinese capital account restrictions. Arguably places like London and perhaps the main Canadian cities are now in prime residential bear markets.
But inflation is strongest nearest the source. Seems on the surface that Hong Kong is still going strong:
http://www.zerohedge.com/news/2017-06-15/demand-hong-kong-micro-apartments-surges-buyers-downgrade-expectations
But Chinas credit impulse is now negative and credit creation has to be better managed as part of the Chinese economic restructuring/ rebalancing.
http://www.zerohedge.com/news/2017-06-15/kyle-bass-chinas-credit-bubble-metastasizing-still-short-yuan

So I dont see the outlook over say a 2-5 year view for Hong Kong resi being very good if things go well, and if there is some sort of crisis it will get destroyed.
This is what happened post 1997 with the Asian crisis and unification:

Basically property prices more or less went back to pre-1993 prices by 2003 (I dont have pre-93 prices but the Jan 93 index was 84 and the market bottomed out in the 60's). ie everyone who bought after 1993 was significantly underwater. If you bought near the peak you had a drawdown from 1997 through to the bottom in 2003 and it took until 2011 and a new Chinese credit bubble to get back to flat. The drawdown from the top in 1997 was 66%, even it you ignore the extremes, many people will have had 40-50% drawdowns.
10-20 years is a very long time in someones life cycle to wear negative equity. You have to wonder if they will just default instead which raises questions about the solvency of the Hong Kong banking system.
I have no idea when Hong Kong residential will blow up, but bubbles always pop and probably all it takes is one administrative decision to do it from here. China's credit bubble is unprecedented. The price action since 2015 also looks volatile and turning points are often associated with volatility, ie bull traps.
Update:
I thought I would look at rents, as in the end they underpin capital values. Rents also have fallen in downturns (post-97 and 2008), but capital values have massively outpaced rents in this cycle, further evidence of capital flight/ hoarding.

But inflation is strongest nearest the source. Seems on the surface that Hong Kong is still going strong:
http://www.zerohedge.com/news/2017-06-15/demand-hong-kong-micro-apartments-surges-buyers-downgrade-expectations
But Chinas credit impulse is now negative and credit creation has to be better managed as part of the Chinese economic restructuring/ rebalancing.
http://www.zerohedge.com/news/2017-06-15/kyle-bass-chinas-credit-bubble-metastasizing-still-short-yuan
So I dont see the outlook over say a 2-5 year view for Hong Kong resi being very good if things go well, and if there is some sort of crisis it will get destroyed.
This is what happened post 1997 with the Asian crisis and unification:

http://www.rvd.gov.hk/en/property_market_statistics/
Basically property prices more or less went back to pre-1993 prices by 2003 (I dont have pre-93 prices but the Jan 93 index was 84 and the market bottomed out in the 60's). ie everyone who bought after 1993 was significantly underwater. If you bought near the peak you had a drawdown from 1997 through to the bottom in 2003 and it took until 2011 and a new Chinese credit bubble to get back to flat. The drawdown from the top in 1997 was 66%, even it you ignore the extremes, many people will have had 40-50% drawdowns.
10-20 years is a very long time in someones life cycle to wear negative equity. You have to wonder if they will just default instead which raises questions about the solvency of the Hong Kong banking system.
I have no idea when Hong Kong residential will blow up, but bubbles always pop and probably all it takes is one administrative decision to do it from here. China's credit bubble is unprecedented. The price action since 2015 also looks volatile and turning points are often associated with volatility, ie bull traps.
Update:
I thought I would look at rents, as in the end they underpin capital values. Rents also have fallen in downturns (post-97 and 2008), but capital values have massively outpaced rents in this cycle, further evidence of capital flight/ hoarding.
Wednesday 14 June 2017
What the heck is happening in oil and what's the outlook?
I commented on oil previously, but decided to look again now its fallen back in price.
So with the advent of shale being ramped up into 2014 and huge offshore and OPEC capex in the preceding 10 years, oil went into a supply surplus in 2014 triggering a brutal and drawnout bear market.
Essentially price was driving a supply/ demand rebalancing; this time from the standpoint of oversupply, as opposed to $80-120 oil prices choking off demand in the 2003-2014 period, ex-GFC.
The market bottomed in the $20s last March and started to rebound as the excess of supply tightened and market participants moved on from the Q1 China growth scare, EM started rebounding and the market looked for a natural rebalancing into this year and 2018.
What caused this? Demand was weak in the US and EM demand growth disappointed, shale supply continues to build, offshore production has been sticky and OPEC, while reducing production have increased supplies to keep the physical market well supplied while drawing down inventories. The below chart shows the market moving to a slight draw in Q2, this might have happened last year except for the ramp up in US shale production and slowing demand growth.


Meanwhile demand continues to grow, from 95mbpd in 2015 to an estimated 97.9mbpd in 2017 and probably over 99mbpd in 2018 and again probably over 100mpd in 2019.

So coming into Q2 the market started to look at the stability of conventional supply vs the expected ramp up in shale and concluded that the increase in shale was going to keep the market 'lower for longer'. Analysts such as those at Goldman predicted a backwardation in the curve, where OPEC keep prices high in the near term with production cuts and supply management, but the market then looks for excess supply next year as shale continues to grow as part of their lower for longer thesis. In otherwords Goldman suggested their clients buy front end oil and sell forward oil. Needless to say the front end promptly collapsed as physical producers liquidated into that.


Looking at the charts above, the view being pushed is that growth in shale production will push down medium term prices set against a supposed economic cost for shale at ~$50.
So in the short term the market has sold off and could potentially sell off more on a growth scare. Then medium term, the question is are these sell side medium term assumptions of $50-55 a barrel valid?
I dont have any problem with US shale production growing. The one point I would make is that anecdotally most of the supposed fall in breakevens has been due to the bust in the space and prices for all parts of the supply chain falling. As shale production grows pricing power should come back for people/ wages and suppliers/ capital costs, that should push the marginal cost of shale back up. I have seen suggestions that only 10% in the fall in shale well costs are down to drilling improvements. This might push the cost of the marginal barrel of shale back to the $60-70 price range.
Demand seems to grow at 1-2mmbpd every year, driven by growth and industrialisation in EM, which is partly offset by efficiency improvements in DM and increased use of electrical cars etc, particularly when $80 plus oil drives efficiencies in DM and curtails EM demand. Even if there is a recession in the US, global demand will likely still grow 1mmbpd over the period as neither the US nor Europe are contributing much to demand growth.


So that comes back to OPEC and offshore supply. If demand is growing 1-2mmbpd for the next few years, and shale goes from 5mbpd or so now to ~8mbpd in 2020 that covers 3mbpd of the expected 3-6mbpd in demand growth, add in some OPEC production cut reversals or OPEC growth and there is no real shortage in oil out to 2020 and the oil price should rest at the marginal cost, which for shale swing producers is about $50. i.e. from a short term perspective the upside is capped and the downside is defined by demand risks.
So the medium term trillion dollar question is will offshore production flatline over the next three years, or decline? It has been well supported since 2014 as offshore projects that were 10 years in the making came online and then ramped up production. Clearly offshore capex has seen hundreds of billions of dollars in cutbacks since 2014. So question is what happens to offshore supply? Looking through some interviews and articles, there seems to be few clear views, even forecasts for US shale production vary wildly with the IEA forecasting much less supply growth then Goldman.
As such its difficult to make well supported forecasts for global oil supply, but I can draw a few inferences.

In the chart above, offshore is 30% of global supply. That is on the back of 10 years of capex since the early noughties which delivered a reasonably flat production share, or slightly down from 32% in 2005 to 29% in 2015. Any reduction in capex since 2014 should, ipso facto, lead to falling market share and falling production, at some point.
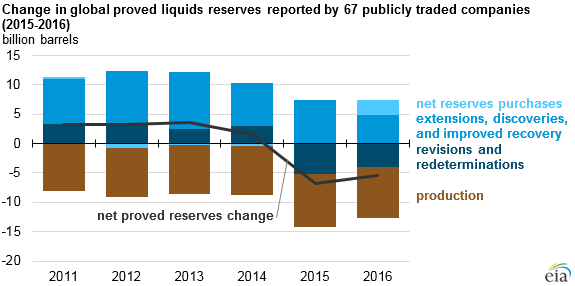
Proved reserves amongst the larger public listed companies have fallen about 5% a year since 2014, mostly due to production and write downs offsetting ongoing discoveries, while discovery rates have also declined:

Capex has not significantly recovered yet, at least outside of shale and with long lead times both discoveries and new development commissioning should remain low for the time being.
Lets just hypothesise that if reserves are falling 5% a year and capex has been reduced to maintenance and not focussed on new development, then offshore production falls 2.5-5% net per year for several years. Without maintenance and work overs decline rates on older fields can be up to 18% per year in deep water fields that have high initial production rates (and therefore shorter lives and higher decline rates), while in large onshore fields decline rates are often much less. Without having much data on either decline rates or what is scheduled to be brought onstream its difficult to predict how offshore production will develop and as mentioned its hard to find accurate decline rate data or expected supply data.
Assuming an overall offshore production decline rate of 2.5-5%, this would be the equivalent of a decline in offshore production from existing fields of between 600kbpd and 1.2mbpd, per year, for each of the next few years.
At the moment the IEA in their 2017 oil market report are forecasting this dynamic only affecting the market in 2020-2022, but it seems to me that if offshore production disappoints it could be a market focus much sooner.
We have the potential for up to 1mbpd/ year of shale growth, although other forecasts are less aggressive
We have the potential for a 600k-1.2mbpd decline in offshore production, but it remains to be seen how offshore production develops given the capex cut backs since 2014.
So the supply/ demand scenarios based on those estimates is between a 600kbpd and a 2.2mbpd deficit growing each year, per year.
I havent really tried to take into account other onshore production as its a minority of the market and often not high cost like offshore often is.
Overall the market is more than adequately supplied right now, assuming demand growth. However if the US/ China has a recession scare or recession then oil at the front end could fall to $35-40/ barrel, I think, before physical hedgers would stop selling.
However moving into next year or later in 2017, the focus is likely to return to the interplay between declining inventories, OPEC production, shale production, demand growth, and crucially the impact on offshore production in 2018-2020 from the reduced capex since 2014.
With some recovery in wages and costs the marginal cost of shale in my view will go back over $60, which makes a $60-70 range feasible for OPEC next year.
Longer term the evidence was that it took $80-120 to really choke off demand if the market goes into a more meaningful deficit.
So it seems the tightness of the oil market is pushed back for now by weak demand, potential growth scares and ramped up shale production, however after that, the focus will switch back to demand growth vs weak offshore supply.

So with the advent of shale being ramped up into 2014 and huge offshore and OPEC capex in the preceding 10 years, oil went into a supply surplus in 2014 triggering a brutal and drawnout bear market.
Essentially price was driving a supply/ demand rebalancing; this time from the standpoint of oversupply, as opposed to $80-120 oil prices choking off demand in the 2003-2014 period, ex-GFC.
The market bottomed in the $20s last March and started to rebound as the excess of supply tightened and market participants moved on from the Q1 China growth scare, EM started rebounding and the market looked for a natural rebalancing into this year and 2018.
Recent weakness
That rebound trade continued into Q1/Q2 this year. However its been tripped up recently with oil dropping in to the 40s and potentially having more downside in the near term.What caused this? Demand was weak in the US and EM demand growth disappointed, shale supply continues to build, offshore production has been sticky and OPEC, while reducing production have increased supplies to keep the physical market well supplied while drawing down inventories. The below chart shows the market moving to a slight draw in Q2, this might have happened last year except for the ramp up in US shale production and slowing demand growth.

Source: IEA
Meanwhile demand continues to grow, from 95mbpd in 2015 to an estimated 97.9mbpd in 2017 and probably over 99mbpd in 2018 and again probably over 100mpd in 2019.

Source: IEA
So coming into Q2 the market started to look at the stability of conventional supply vs the expected ramp up in shale and concluded that the increase in shale was going to keep the market 'lower for longer'. Analysts such as those at Goldman predicted a backwardation in the curve, where OPEC keep prices high in the near term with production cuts and supply management, but the market then looks for excess supply next year as shale continues to grow as part of their lower for longer thesis. In otherwords Goldman suggested their clients buy front end oil and sell forward oil. Needless to say the front end promptly collapsed as physical producers liquidated into that.


Sources: GS
Looking at the charts above, the view being pushed is that growth in shale production will push down medium term prices set against a supposed economic cost for shale at ~$50.
Outlook
In the short term, the US economic data is coming in fairly weak, inventories are high, supply is going up in shale. Even though the oil market is trading in the high $40's, frankly any sort of growth or demand scare is going to push oil down even further. The CME's economist even suggested $35 was a potential clearing level.So in the short term the market has sold off and could potentially sell off more on a growth scare. Then medium term, the question is are these sell side medium term assumptions of $50-55 a barrel valid?
I dont have any problem with US shale production growing. The one point I would make is that anecdotally most of the supposed fall in breakevens has been due to the bust in the space and prices for all parts of the supply chain falling. As shale production grows pricing power should come back for people/ wages and suppliers/ capital costs, that should push the marginal cost of shale back up. I have seen suggestions that only 10% in the fall in shale well costs are down to drilling improvements. This might push the cost of the marginal barrel of shale back to the $60-70 price range.
Demand seems to grow at 1-2mmbpd every year, driven by growth and industrialisation in EM, which is partly offset by efficiency improvements in DM and increased use of electrical cars etc, particularly when $80 plus oil drives efficiencies in DM and curtails EM demand. Even if there is a recession in the US, global demand will likely still grow 1mmbpd over the period as neither the US nor Europe are contributing much to demand growth.
Source, IEA
So that comes back to OPEC and offshore supply. If demand is growing 1-2mmbpd for the next few years, and shale goes from 5mbpd or so now to ~8mbpd in 2020 that covers 3mbpd of the expected 3-6mbpd in demand growth, add in some OPEC production cut reversals or OPEC growth and there is no real shortage in oil out to 2020 and the oil price should rest at the marginal cost, which for shale swing producers is about $50. i.e. from a short term perspective the upside is capped and the downside is defined by demand risks.
So the medium term trillion dollar question is will offshore production flatline over the next three years, or decline? It has been well supported since 2014 as offshore projects that were 10 years in the making came online and then ramped up production. Clearly offshore capex has seen hundreds of billions of dollars in cutbacks since 2014. So question is what happens to offshore supply? Looking through some interviews and articles, there seems to be few clear views, even forecasts for US shale production vary wildly with the IEA forecasting much less supply growth then Goldman.
As such its difficult to make well supported forecasts for global oil supply, but I can draw a few inferences.
In the chart above, offshore is 30% of global supply. That is on the back of 10 years of capex since the early noughties which delivered a reasonably flat production share, or slightly down from 32% in 2005 to 29% in 2015. Any reduction in capex since 2014 should, ipso facto, lead to falling market share and falling production, at some point.
Proved reserves amongst the larger public listed companies have fallen about 5% a year since 2014, mostly due to production and write downs offsetting ongoing discoveries, while discovery rates have also declined:
Capex has not significantly recovered yet, at least outside of shale and with long lead times both discoveries and new development commissioning should remain low for the time being.
Lets just hypothesise that if reserves are falling 5% a year and capex has been reduced to maintenance and not focussed on new development, then offshore production falls 2.5-5% net per year for several years. Without maintenance and work overs decline rates on older fields can be up to 18% per year in deep water fields that have high initial production rates (and therefore shorter lives and higher decline rates), while in large onshore fields decline rates are often much less. Without having much data on either decline rates or what is scheduled to be brought onstream its difficult to predict how offshore production will develop and as mentioned its hard to find accurate decline rate data or expected supply data.
Assuming an overall offshore production decline rate of 2.5-5%, this would be the equivalent of a decline in offshore production from existing fields of between 600kbpd and 1.2mbpd, per year, for each of the next few years.
At the moment the IEA in their 2017 oil market report are forecasting this dynamic only affecting the market in 2020-2022, but it seems to me that if offshore production disappoints it could be a market focus much sooner.
Conclusion
So adding it up we have demand growth of 1-2mbpd for the next three years against a market that is in a slight draw net of existing OPEC production cuts, assuming no big US/ Chinese recession.We have the potential for up to 1mbpd/ year of shale growth, although other forecasts are less aggressive
We have the potential for a 600k-1.2mbpd decline in offshore production, but it remains to be seen how offshore production develops given the capex cut backs since 2014.
So the supply/ demand scenarios based on those estimates is between a 600kbpd and a 2.2mbpd deficit growing each year, per year.
I havent really tried to take into account other onshore production as its a minority of the market and often not high cost like offshore often is.
Overall the market is more than adequately supplied right now, assuming demand growth. However if the US/ China has a recession scare or recession then oil at the front end could fall to $35-40/ barrel, I think, before physical hedgers would stop selling.
However moving into next year or later in 2017, the focus is likely to return to the interplay between declining inventories, OPEC production, shale production, demand growth, and crucially the impact on offshore production in 2018-2020 from the reduced capex since 2014.
With some recovery in wages and costs the marginal cost of shale in my view will go back over $60, which makes a $60-70 range feasible for OPEC next year.
Longer term the evidence was that it took $80-120 to really choke off demand if the market goes into a more meaningful deficit.
So it seems the tightness of the oil market is pushed back for now by weak demand, potential growth scares and ramped up shale production, however after that, the focus will switch back to demand growth vs weak offshore supply.
Vene
As an aside, Venezuela with its disastrous management of PDVSA and the broader economy at large is seeing ongoing production falls, and things could get worse before they better, both for PDVSA and the political economy in general, which suggests owning their stressed bonds at this junction a risky proposition even at 50c/$:
Subscribe to:
Posts (Atom)